
VMware Aria Operations (ex vROps Operations) is a powerful tool for monitoring infrastructure, virtual machines, predict resource demands or costs. Use cases is much more. One of them is ability to visualize, provide logs and information from the Tanzu Kuberentes Grid clusters. To obtain insightful data from the nodes you need to use dedicated addon – Management Pack for Kubernetes.
In this article I will show how to enable monitoring for TKGs (vSphere with Tanzu) cluster using VMware Aria Operations.
1. Download and install VMware Aria Operations Management Pack for Kubernetes
First thing is to download and install dedicated addon from VMware Marketplace – Management Pack for Kubernetes. It helps to collect desired data.
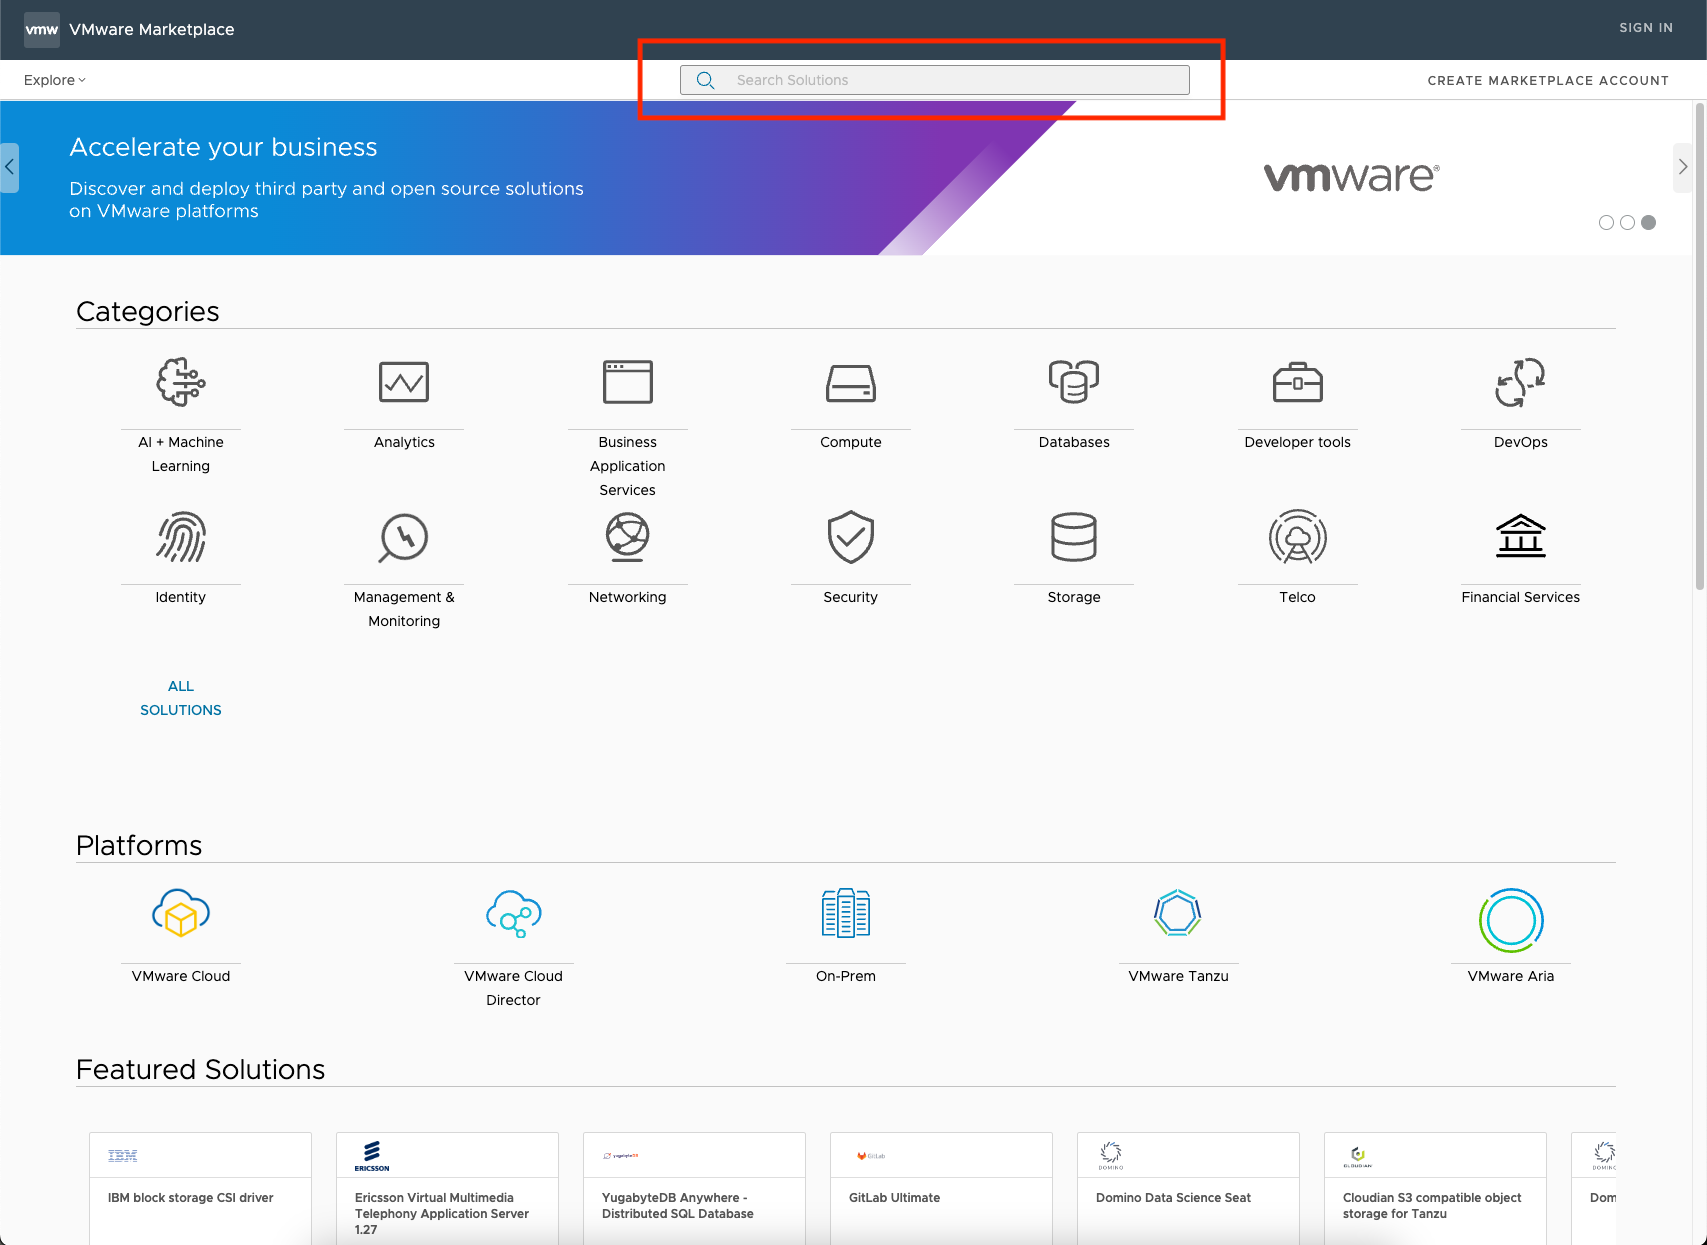
1. Go to VMware Marketplace and find VMware Aria Operations Management Pack for Kubernetes 2.1 – this the newest version for today.
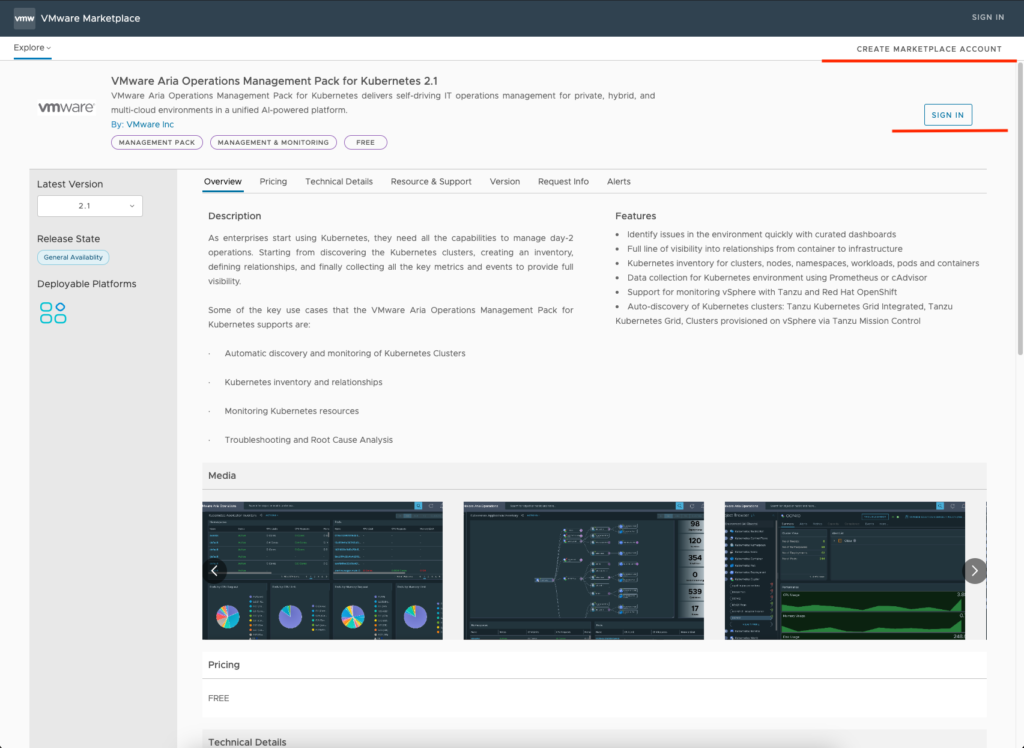
2. Sign in or create a new account in the VMware Marketplace and download a file.
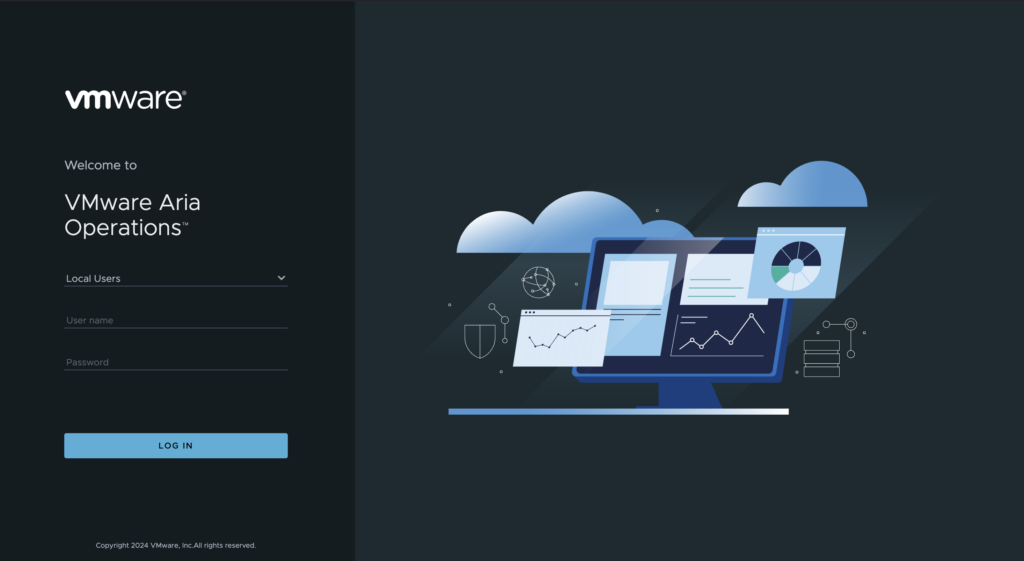
3. Log in to the VMware Aria Operations.
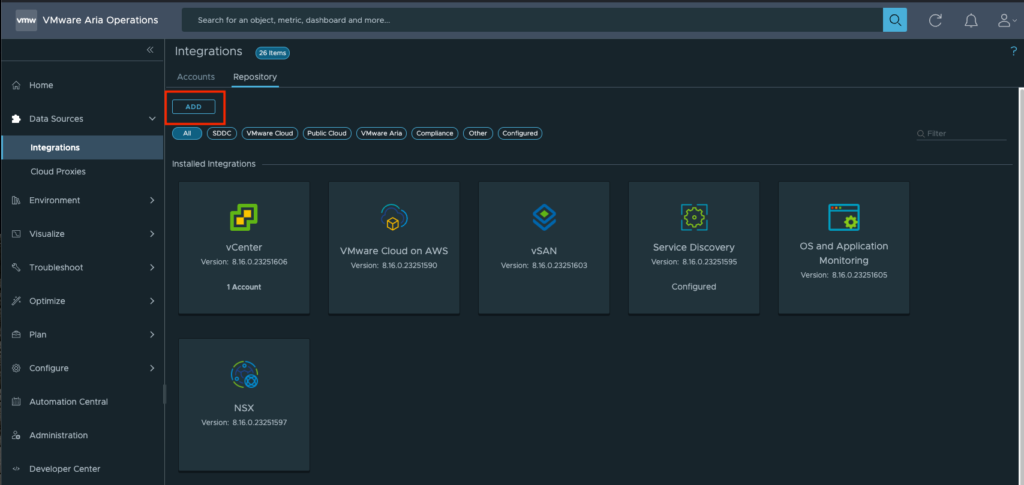
4. Go to the Integrations tab and choose Repository. Click ADD button to add a new Management Pack.
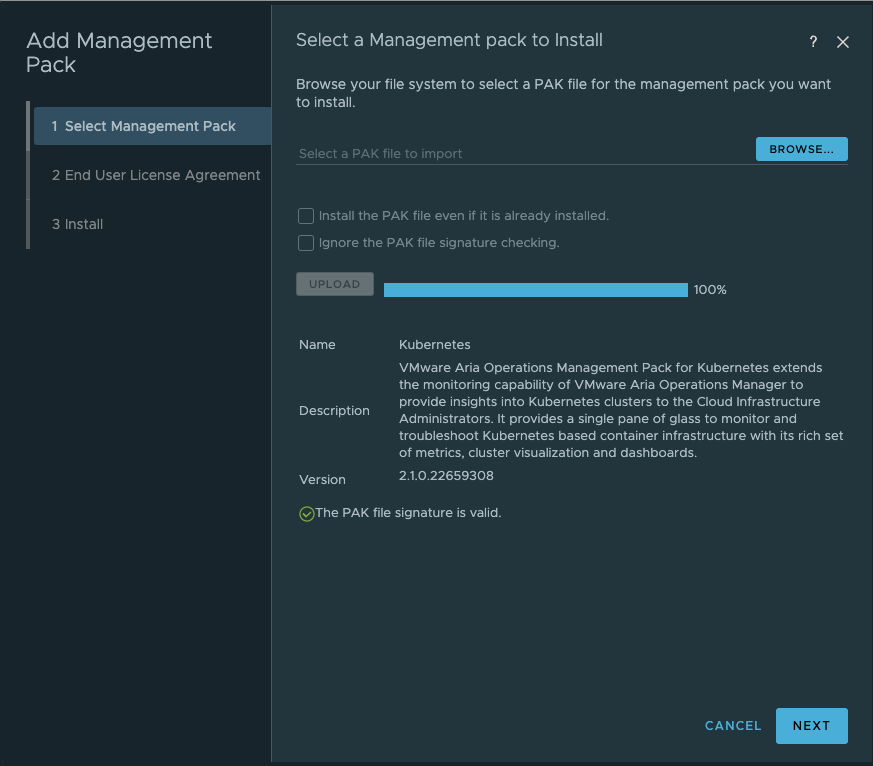
5. Browse for downloaded .pak file and upload it. After that, click next.
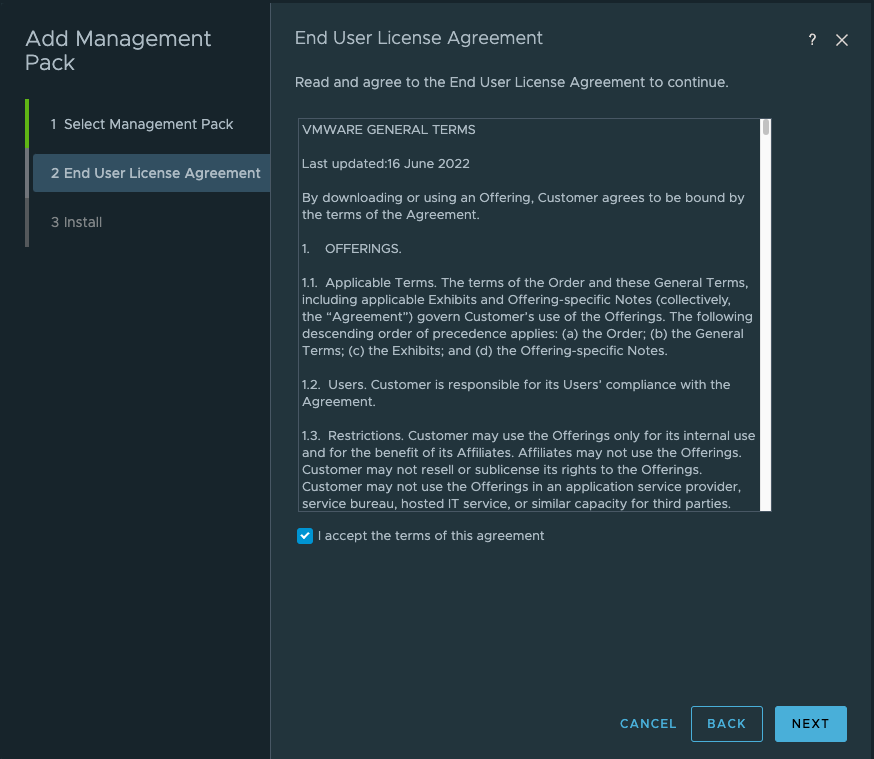
6. Accept the EULA and move forward to the last step.
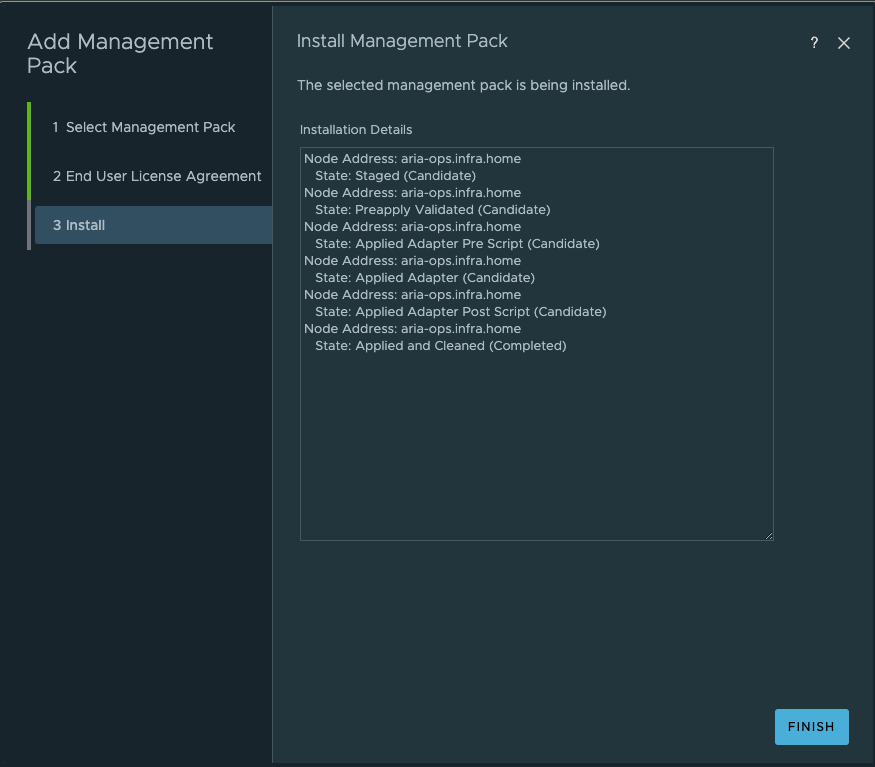
7. Installation take a moment. When it’s done, click finish.
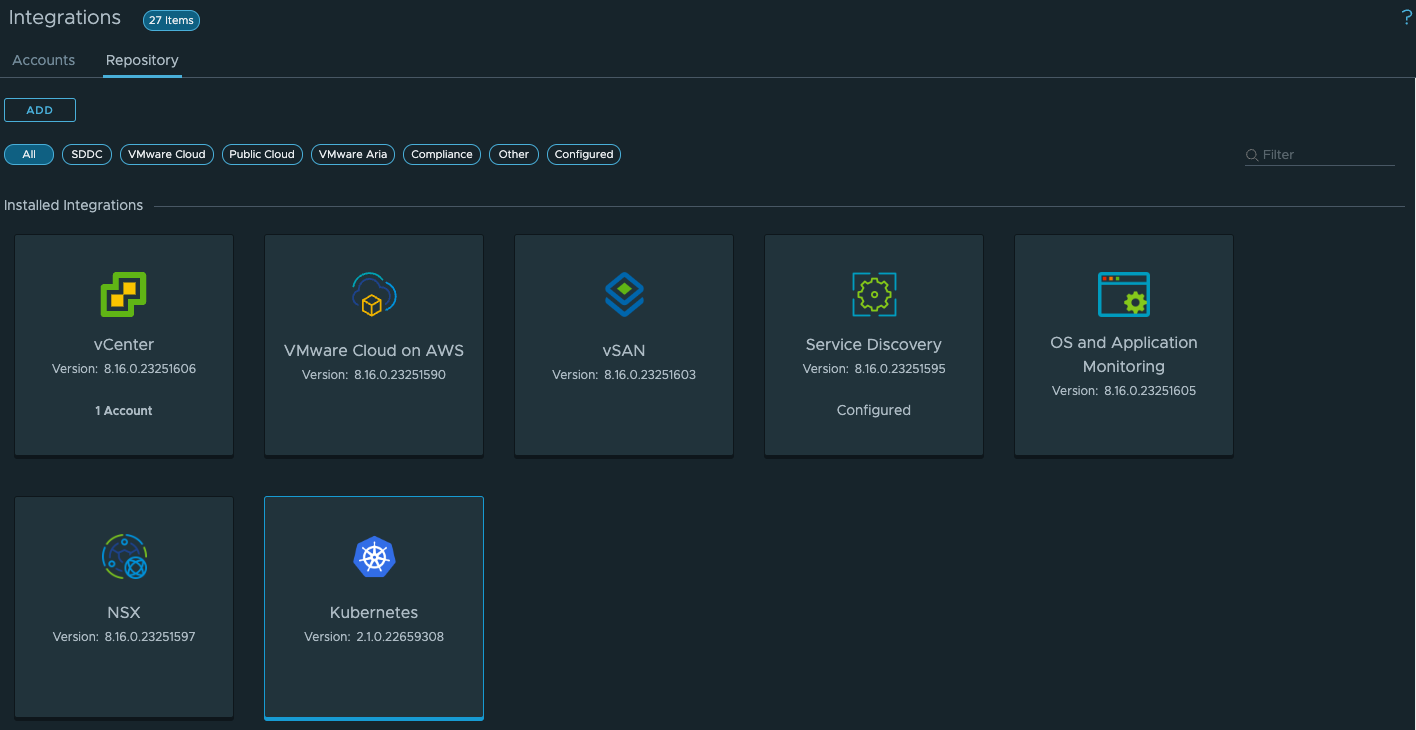
8. In repository section, Kubernetes Management Pack is visible.
2. cAdvisor installation
Next step is to install cAdvior which is a running daemon that collects, aggregates, processes, and exports information about running containers. To monitor TKGs cluster, you can also use Prometheus as a official, supported tool. But in this post, we will use cAdvisor.
1. Go to cAdvisor YAML Definition and copy yaml input – Sample cAdvisor YAML Definition on HostPort
2. !! Important step. This change isn’t mention in the official KB !!
Edit your yaml file. You need to add an additional line: operator: Exists under spec section and hash or delete line key: node-role.kubernetes.io/master. Rest of the setting, leave as is.
Log in to your TKGs workload cluster and apply yaml file.
spec:
tolerations:
- effect: NoSchedule
operator: Exists
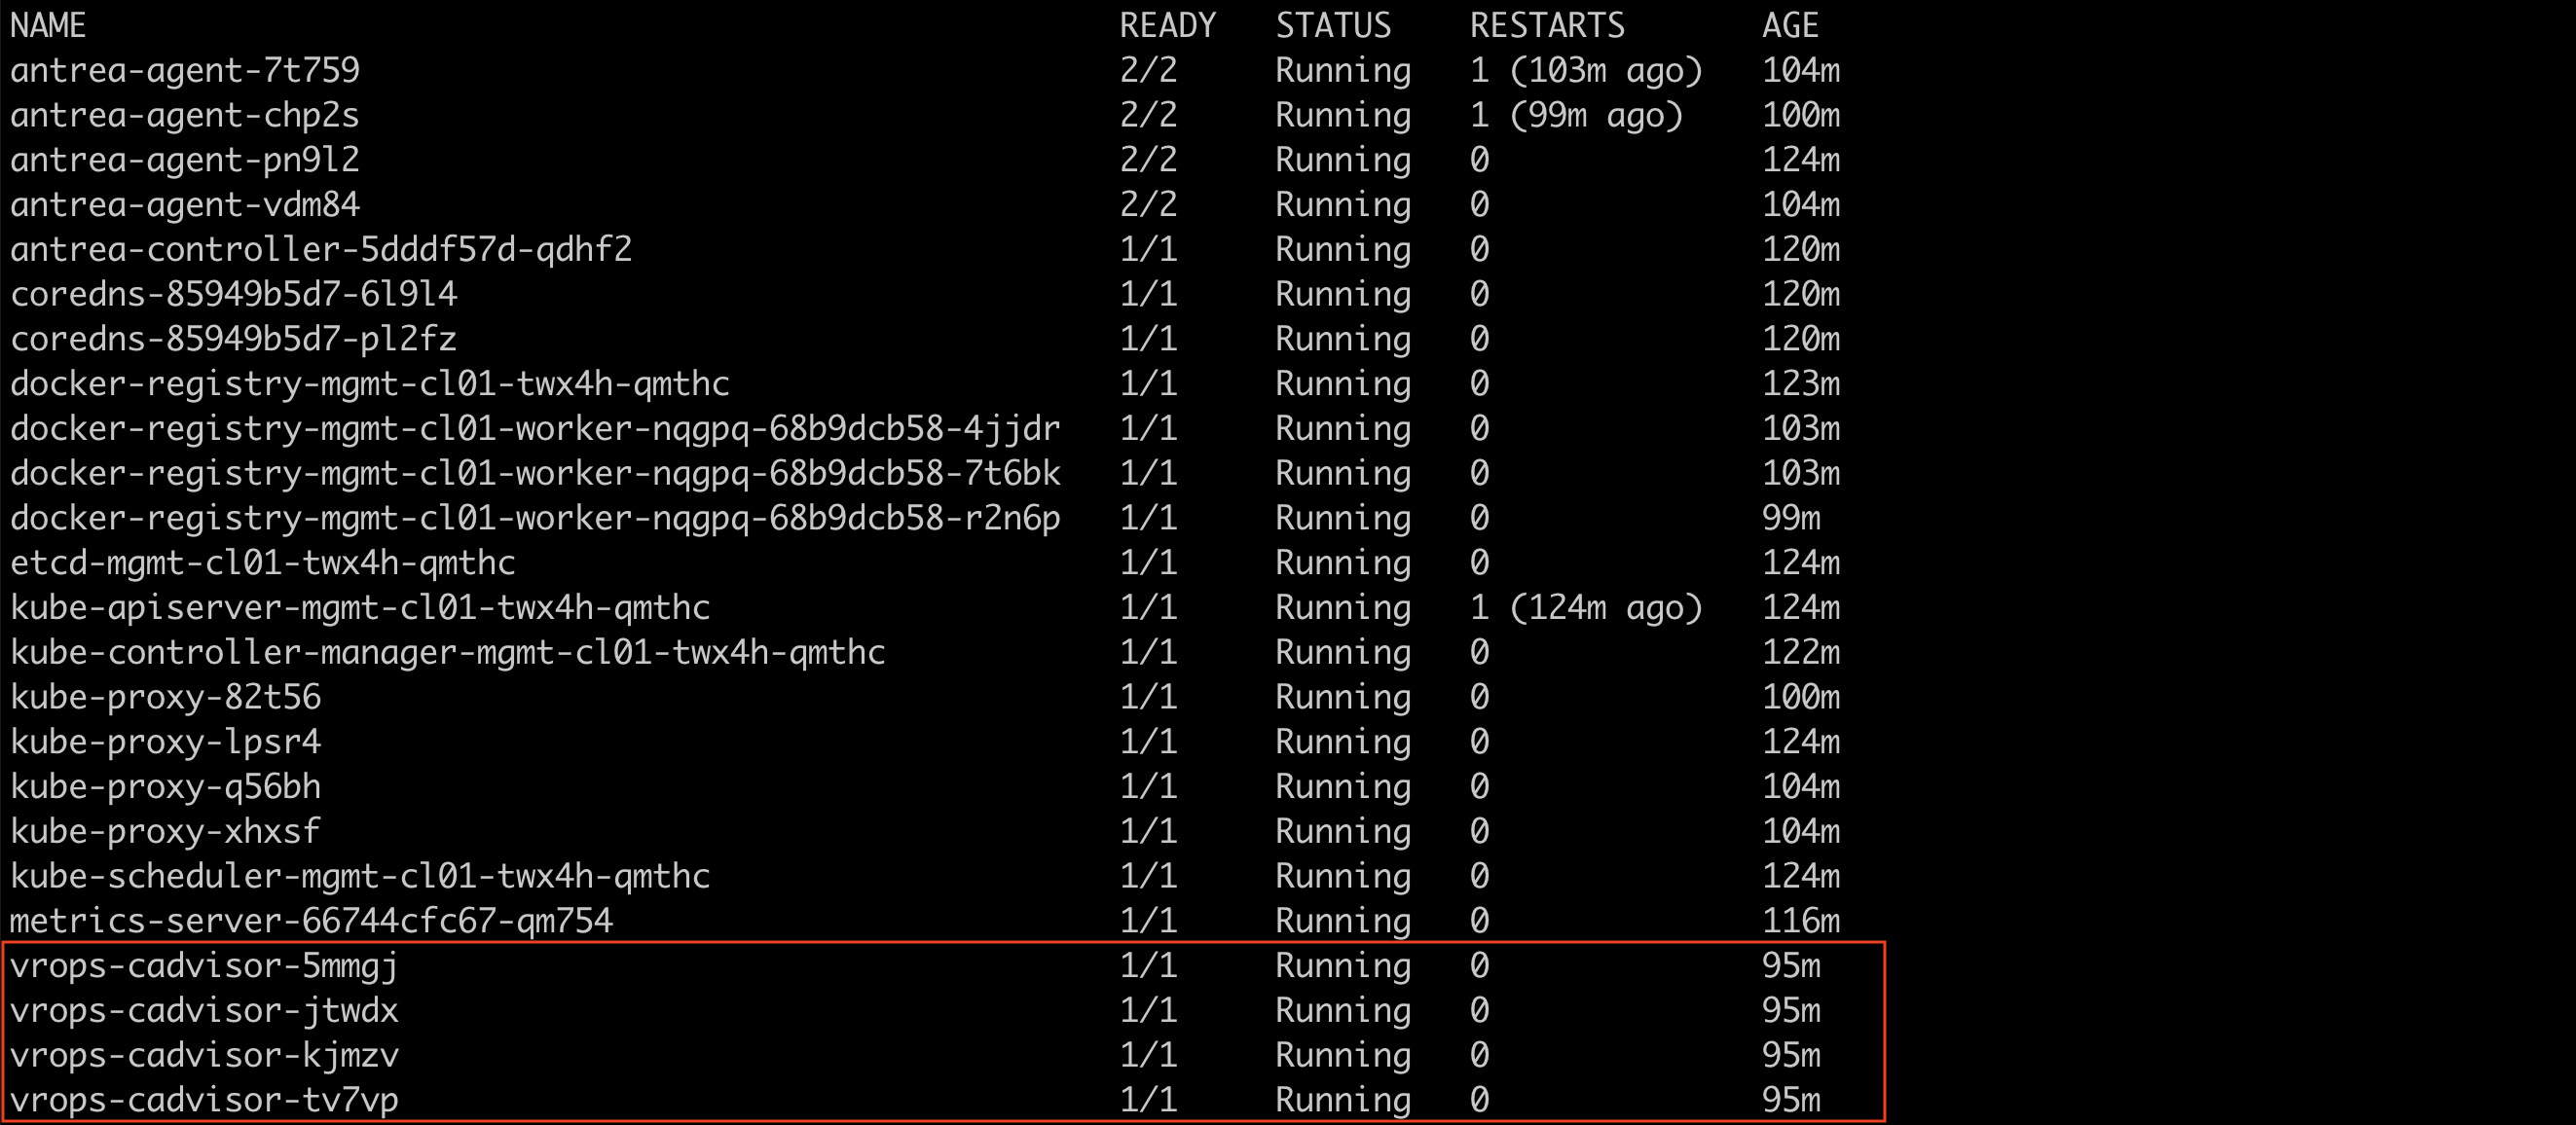
# key: node-role.kubernetes.io/master3. List all pods in kube-system namespace.
vrops-cadvisor pods should appear. It should be as many of it, as amount of all nodes in whole cluster (including masters and workers). If pods status is running, we’re ready to go.
3. Enabling Kubernetes cluster monitoring
Now, it’s time to configure monitoring for the first cluster.
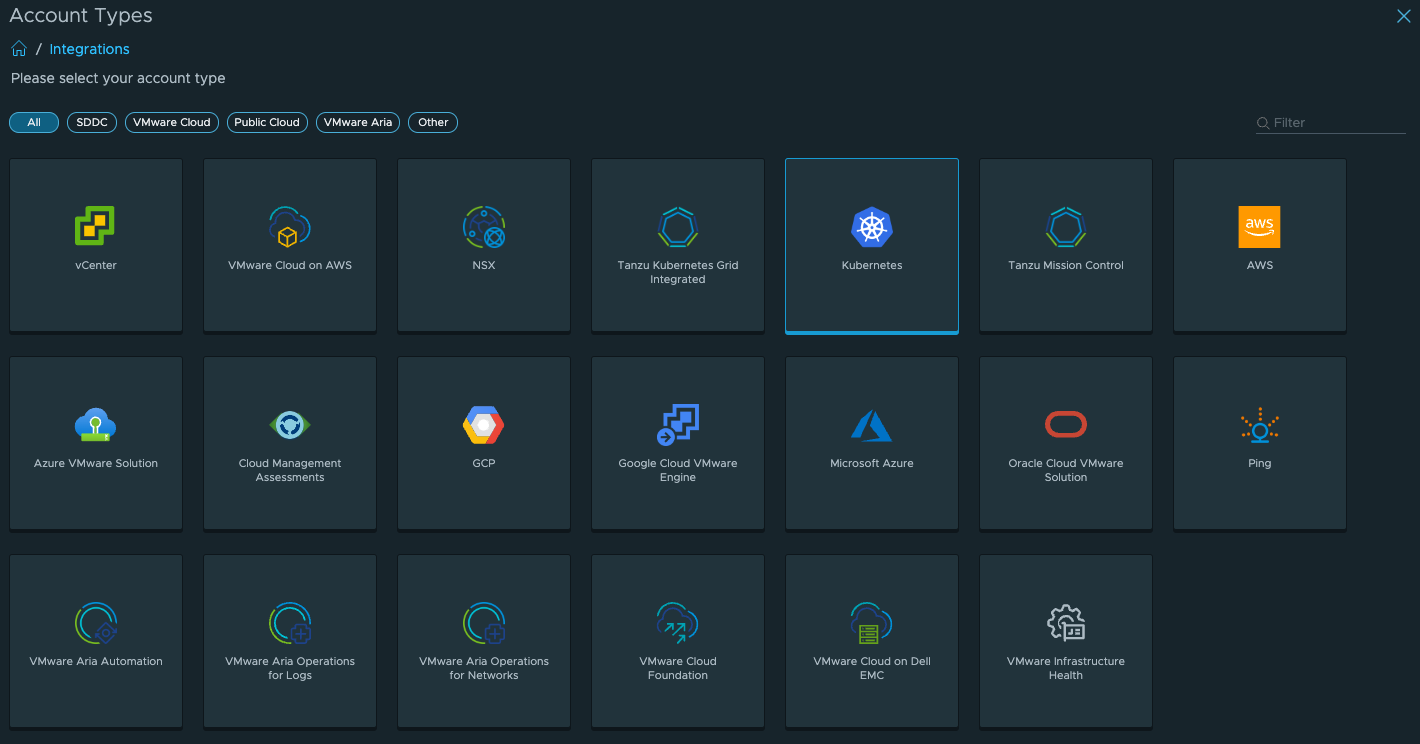
1. Again, go to the VMware Aria Operations, choose Integrations from the left side and choose Accounts. Go with Kubernetes option.
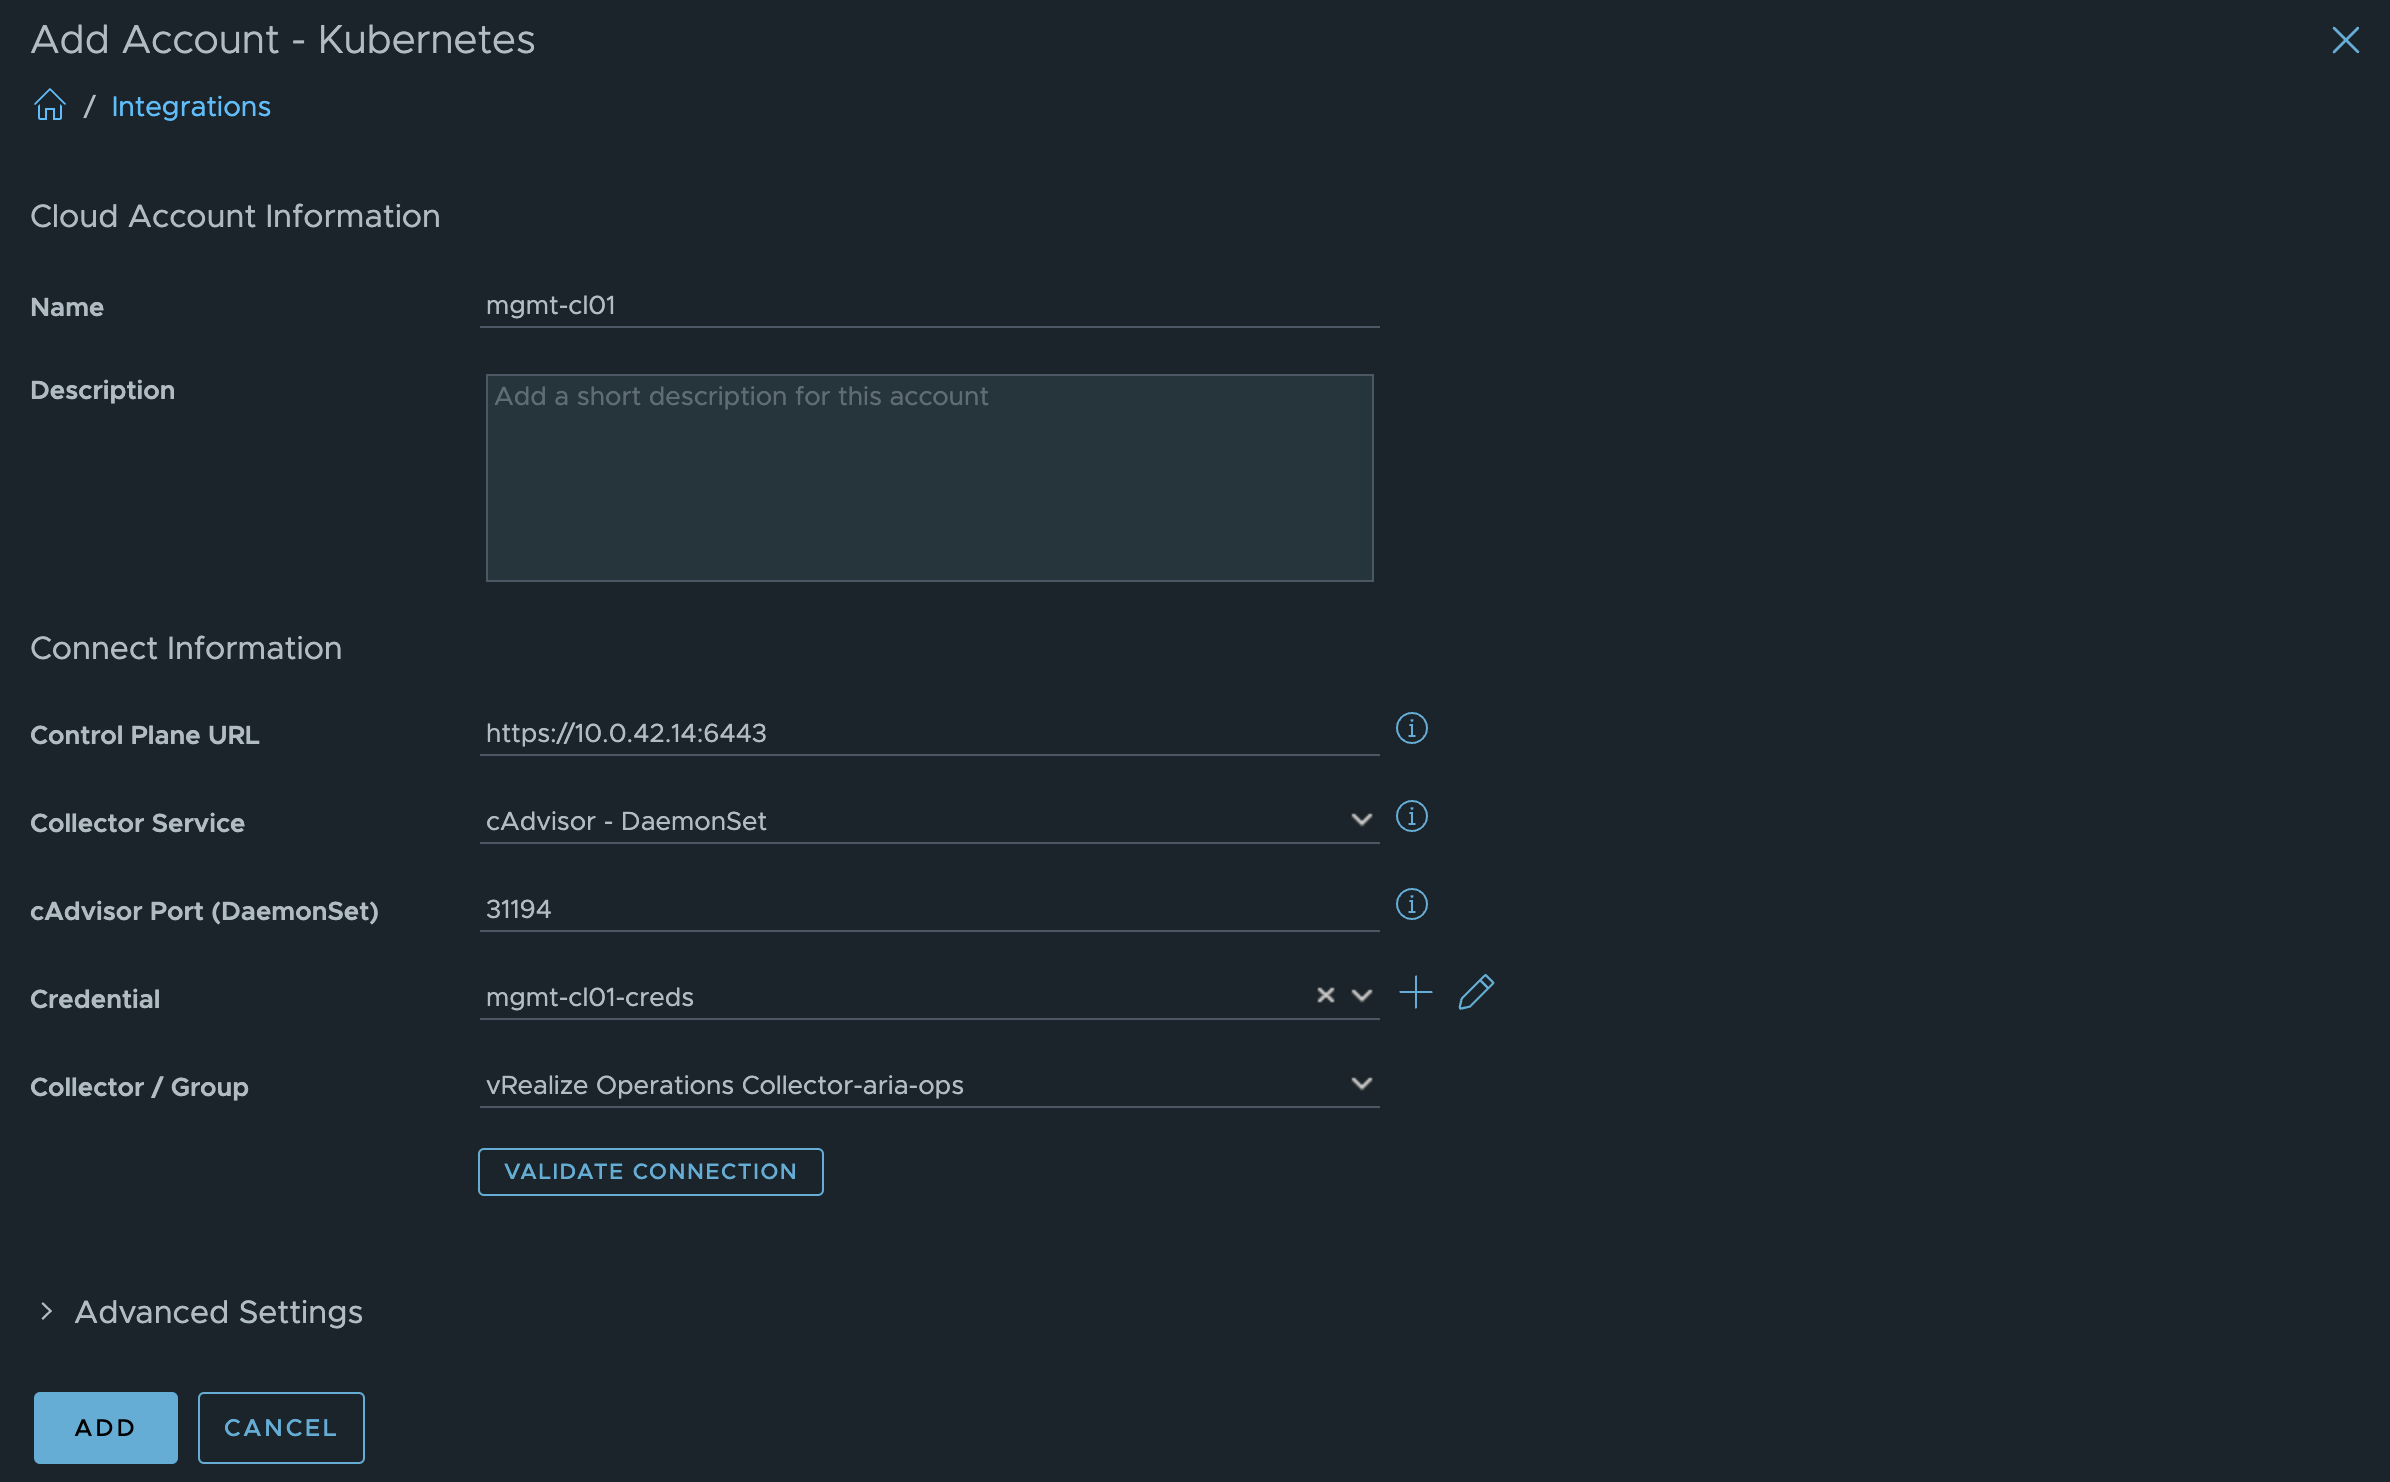
2. Here, we need to configure cluster monitoring settings.
In this example, I will use my TKGs cluster running in the vCenter – mgmt-cl01
Name -> Name of the cluster. Of course, here it can be anything, but it’s easier to manage if this name is equal to the TKGs name ;
Description -> you can add some useful data;
Control Plane URL -> Kubernetes API (endpoint) of the TKGs cluster;
Collector Service -> From 2 available options, choose cAdvisor Daemonset;
cAdvisor Port (Destination) -> by default it’s port: 31194;
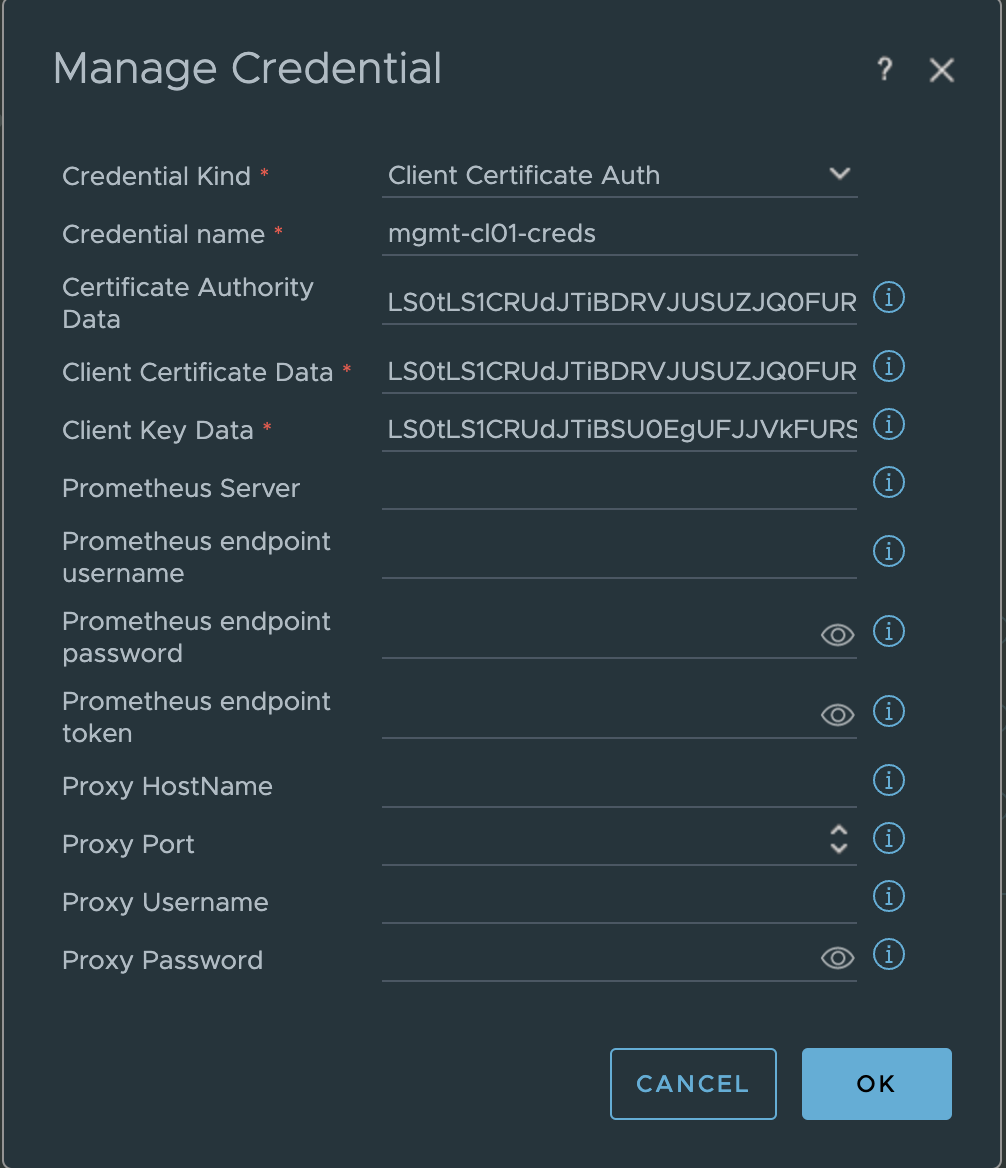
Credential -> Click + to add credentials to communicate with a cluster. From 3 available options, choose Client Certificate Auth as a Credential Kind. Certificate Authority Data, Client Certificate Data, Client Key data copy from your local kubeconfig file;
Default location of the Kubeconfig file in Linux and Mac is:
~/.kube/config
At the beginning of the file you can find Certificate Authority Data:
apiVersion: v1
clusters:
– cluster:
certificate-authority-data:
[data]
server: https://[IP_address]:6443
name: [your K8S cluster name]
Than, further in the file you can find Client Certificate Data, Client Key:
users:
– name: [your K8S cluster name]
user:
client-certificate-data:
[data]
client-key-data:
[data]
Collector /Group – Choose default one or another available.
3. Additionally in the Advanced Settings you can add vCenter Server IP or FQDN.
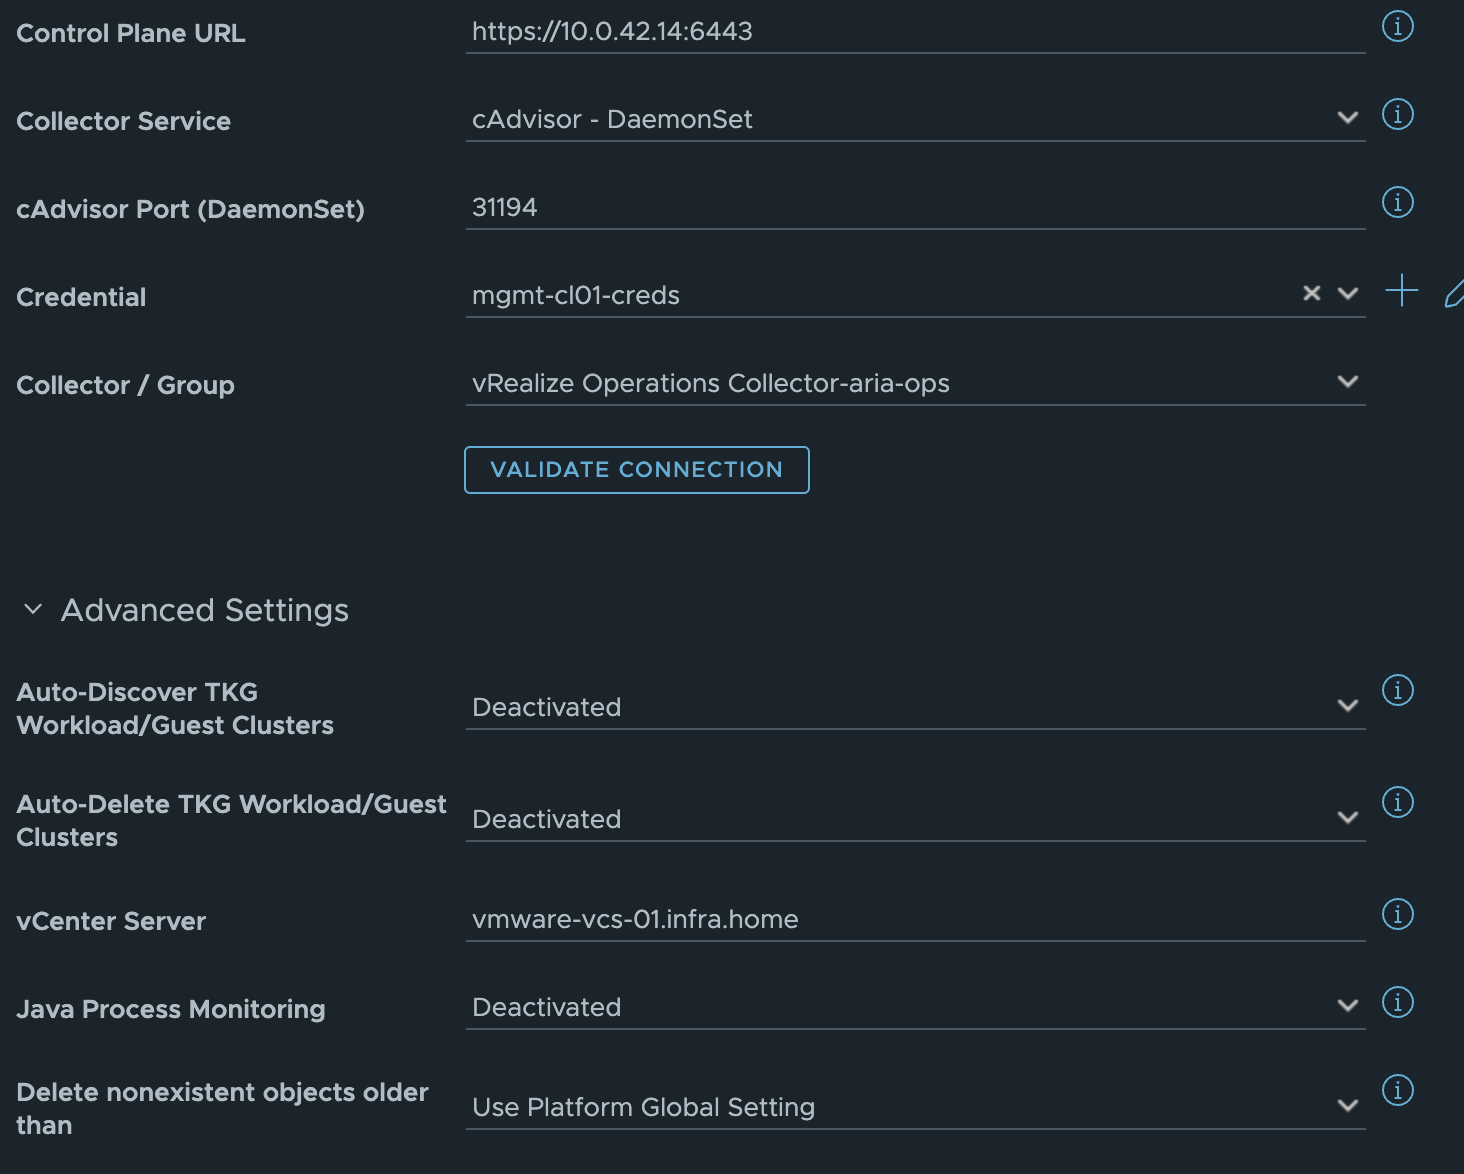
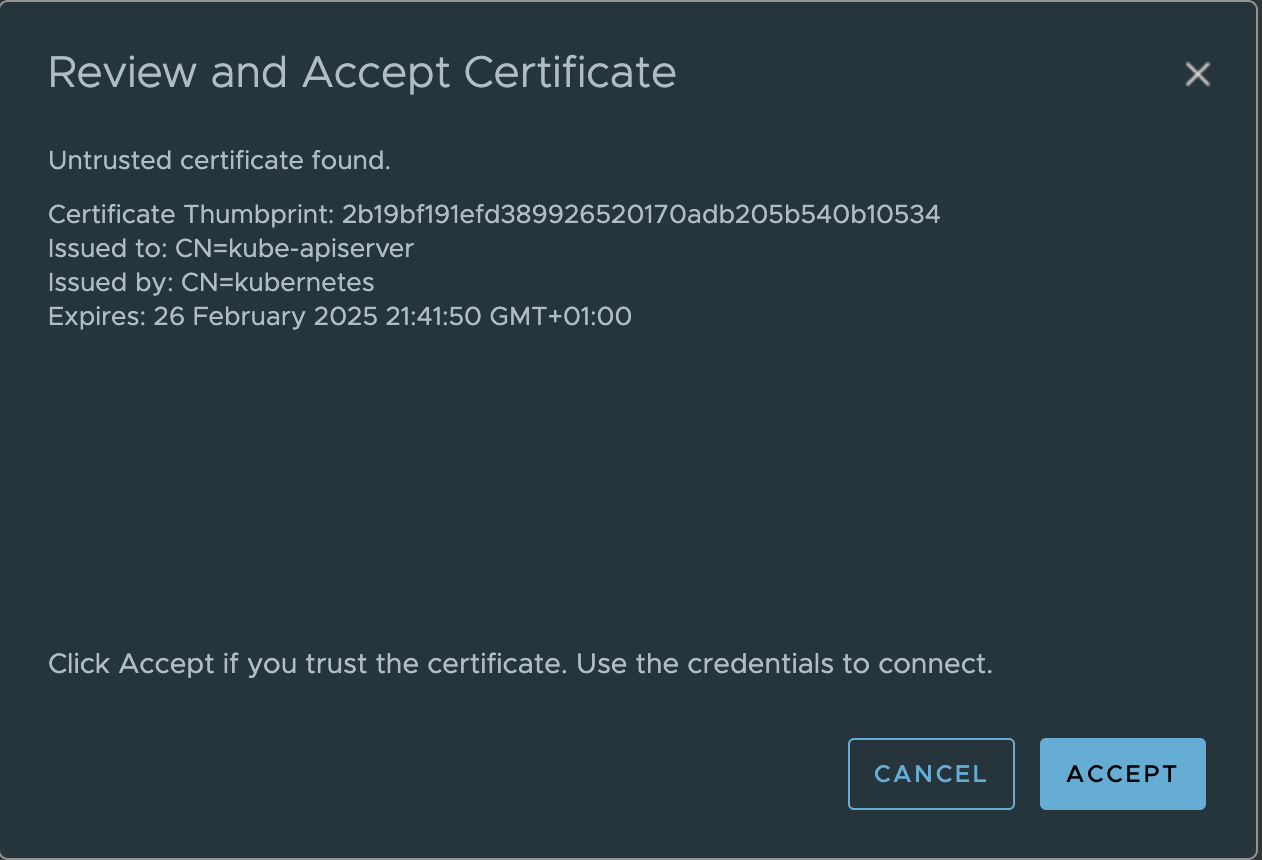
4. Check connection by clicking Validate Connection. If everything is OK, test connection should be successful.
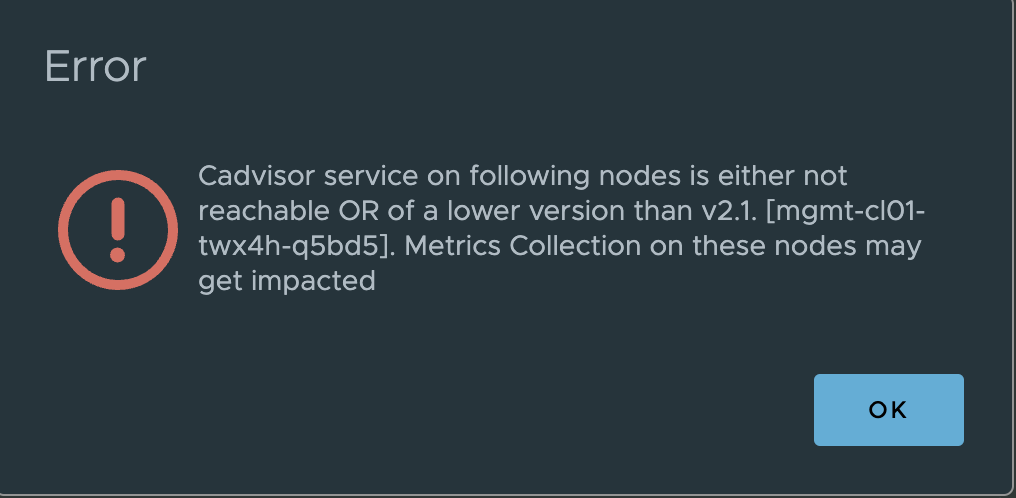
5. If you have this error, you probably missed a step 2 in section 2. Please, check it.
4. Let’s look for some Kuberentes cluster data!
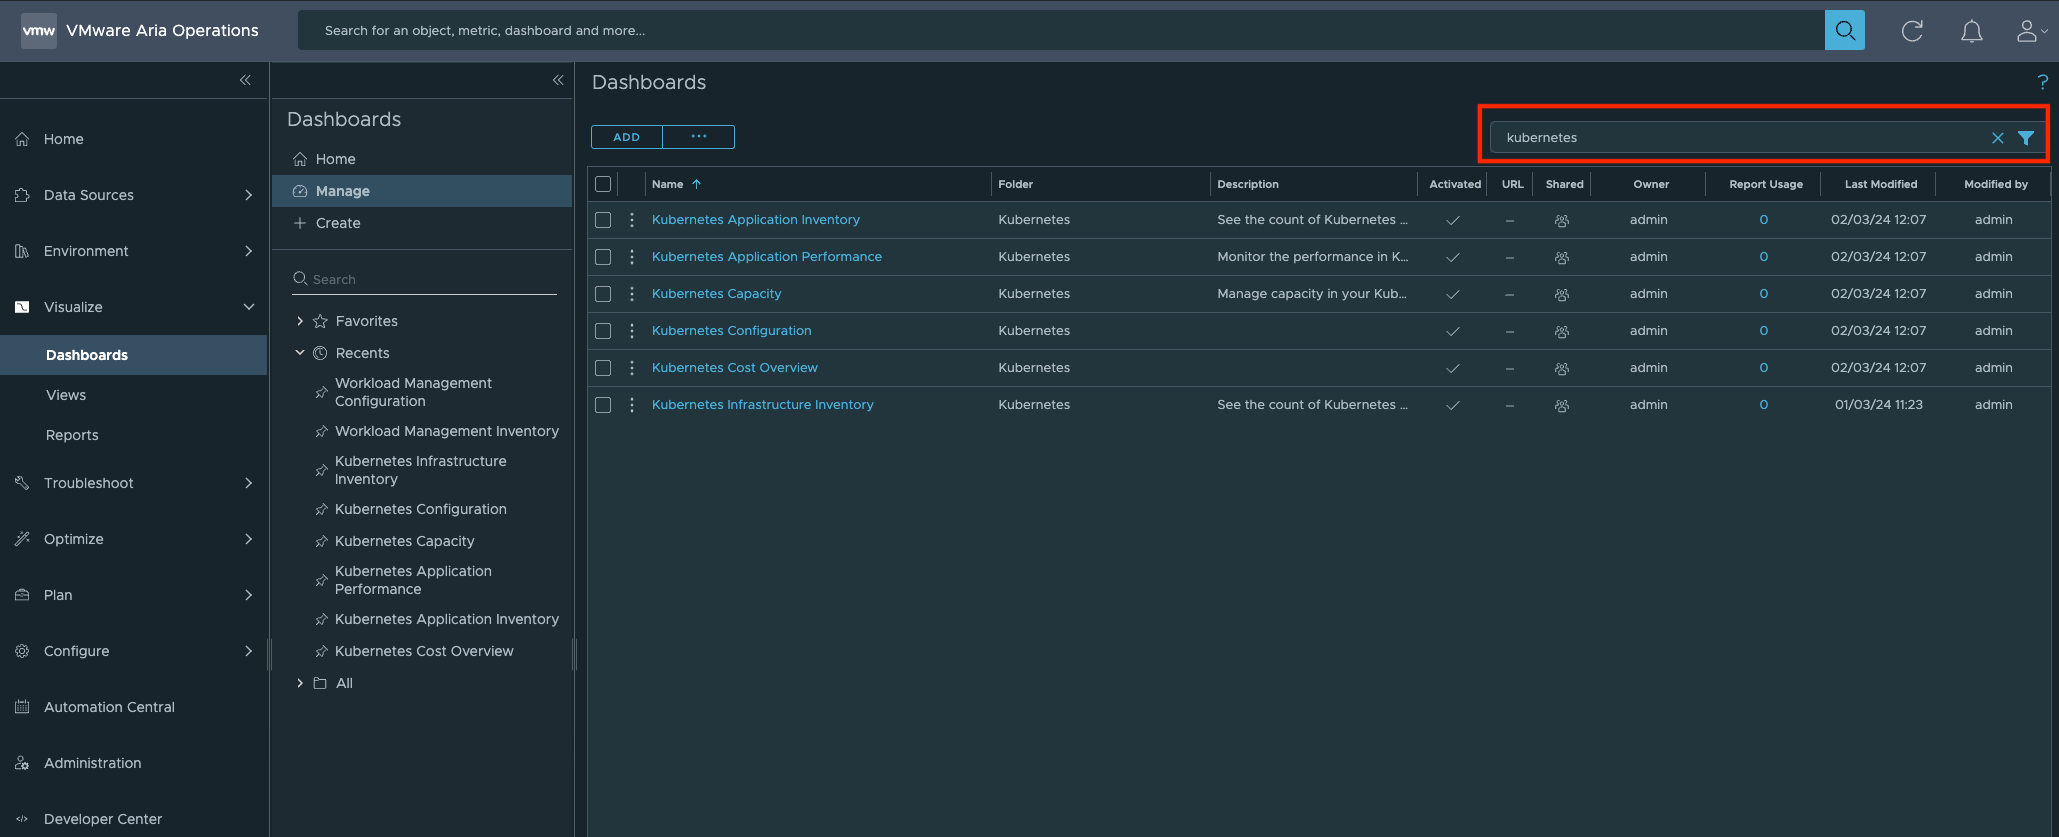
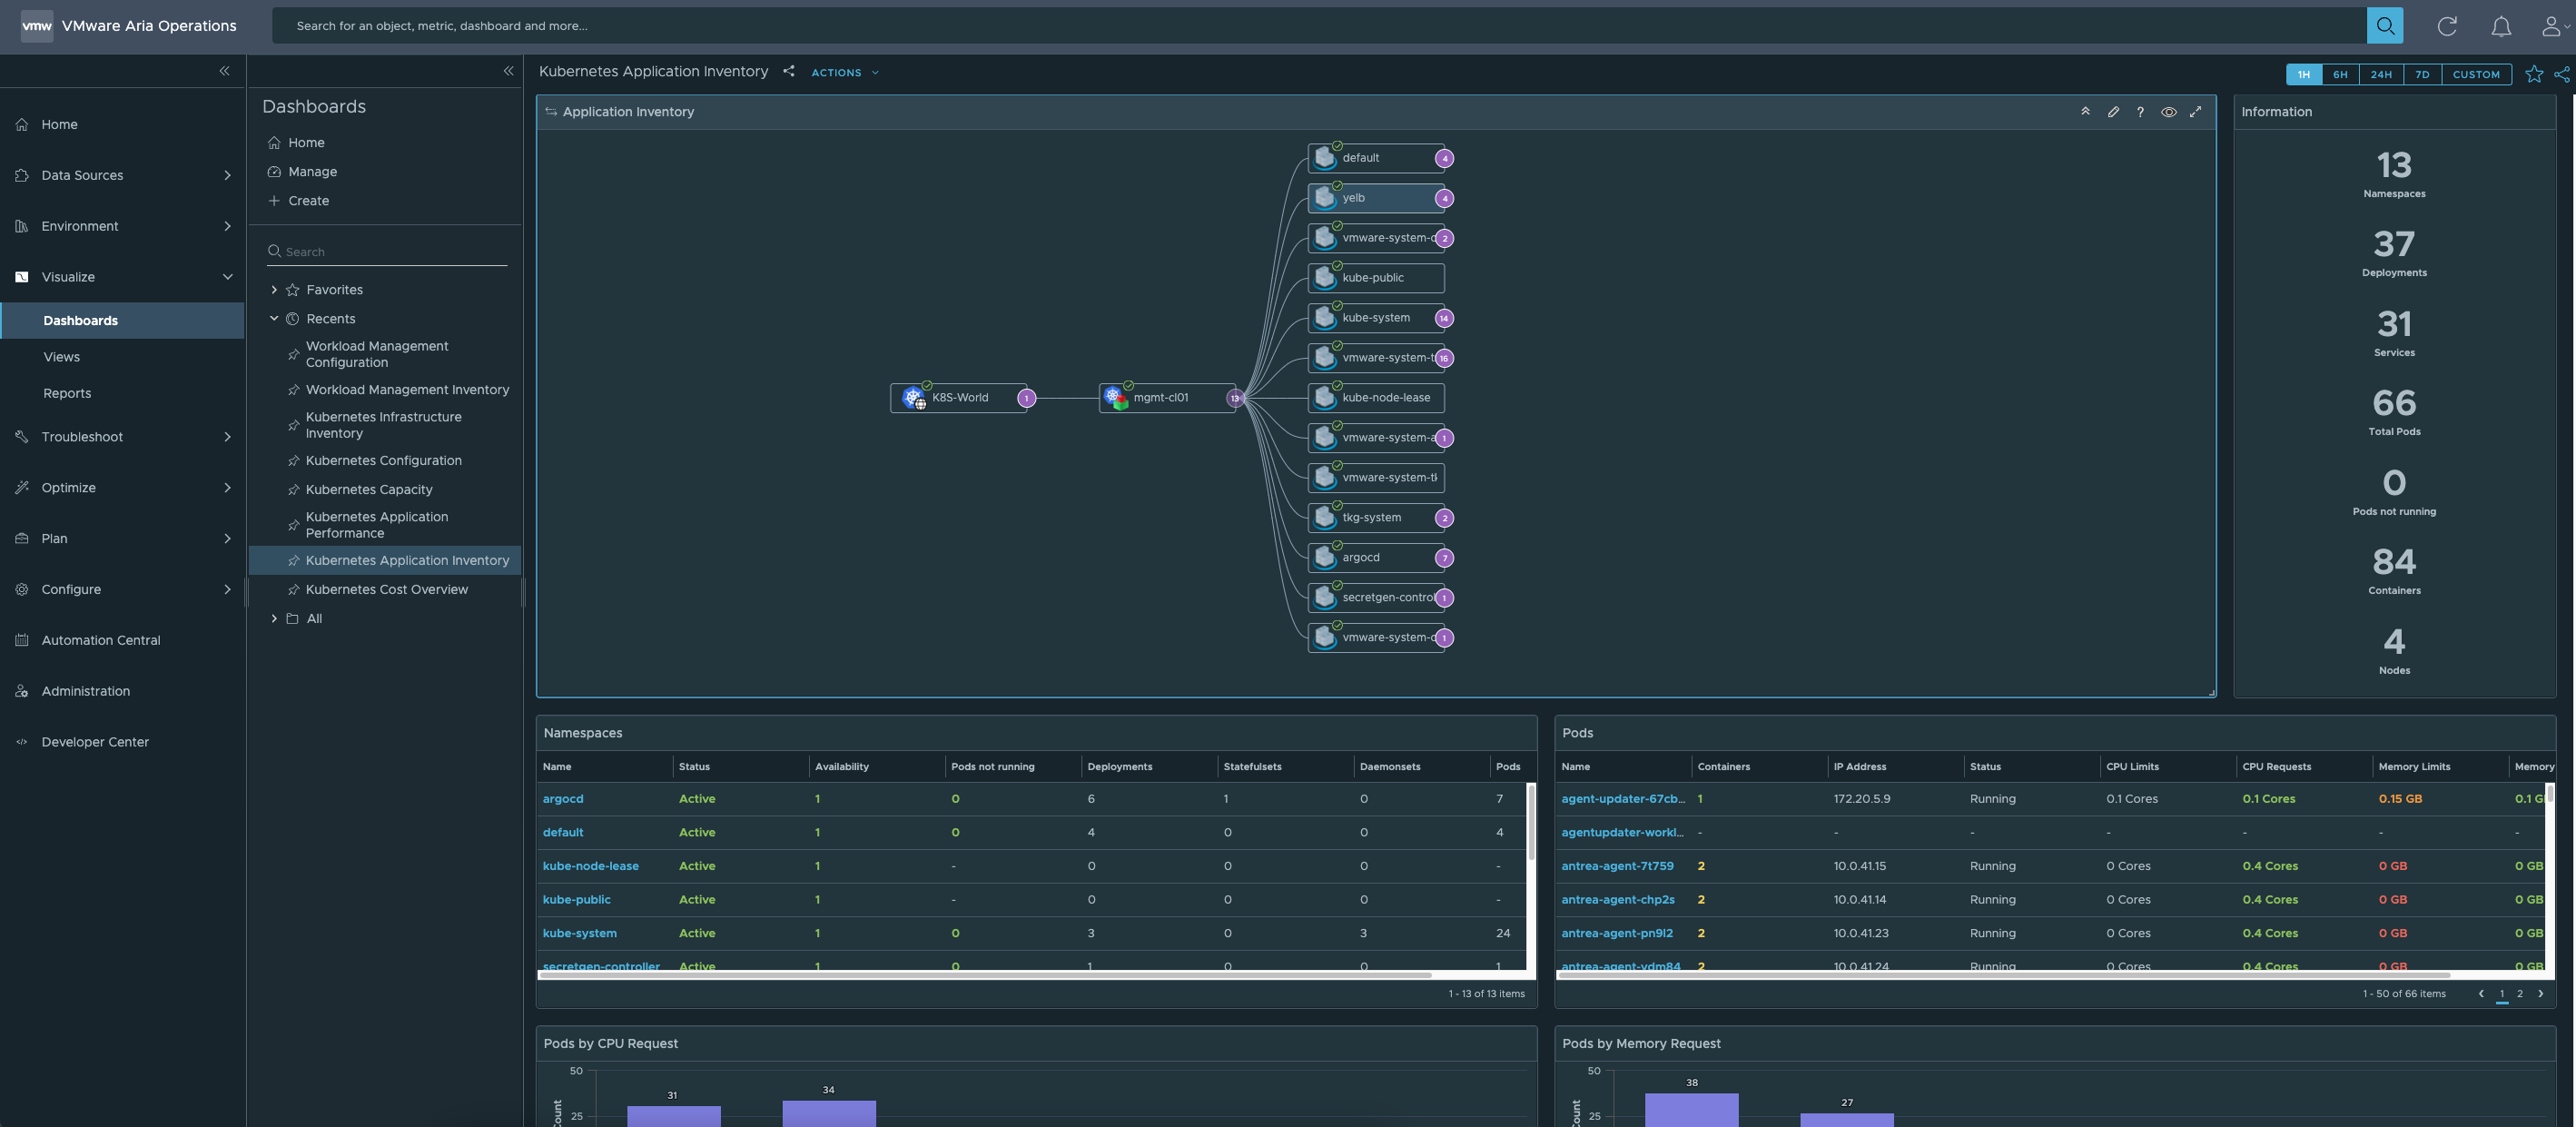
1. Go to Dashboards, choose Manage tab and filter “kubernetes” dashboards from the long list. For example, choose Kubernetes Application Inventory.
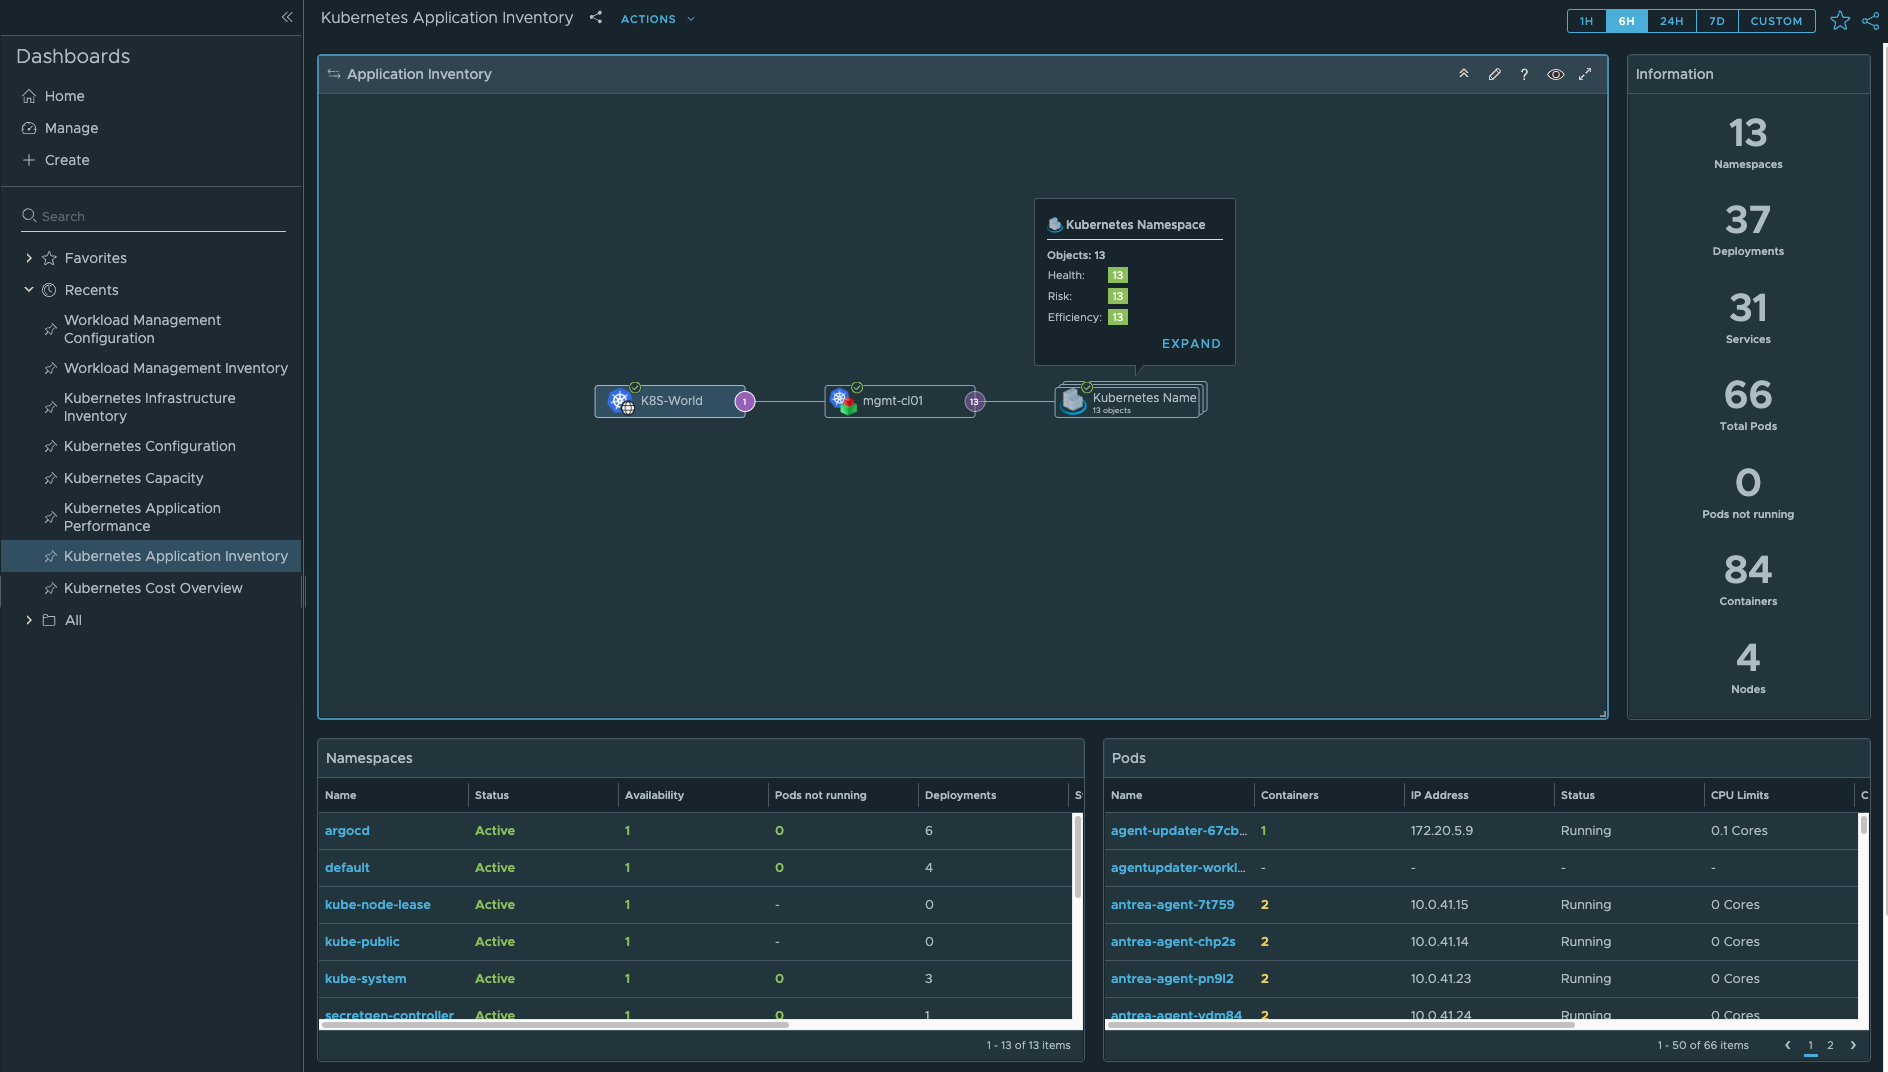
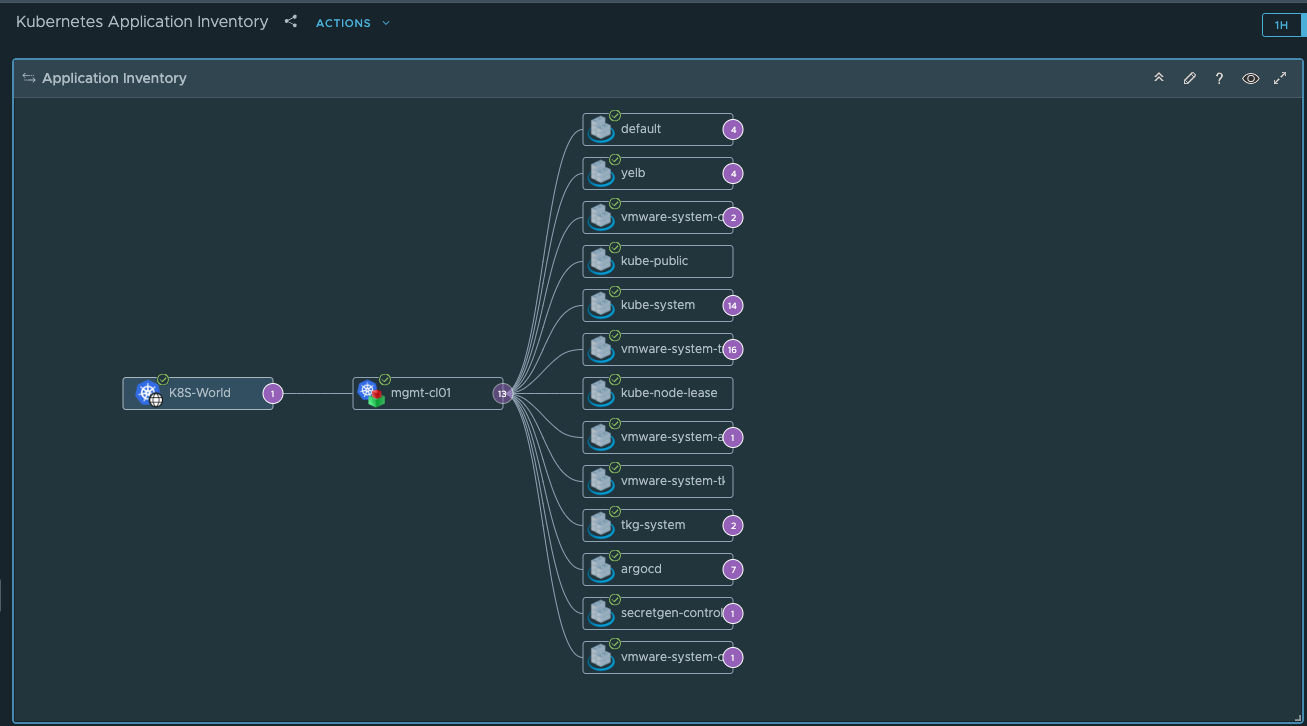
2. There is an added mgmt-cl01 cluster with preliminary information about this resource. Double click on Kubernetes Namespace in the diagram to list all Kubernetes namespaces existing in the cluster. You can go deeper and see more details by clicking on every namespace.
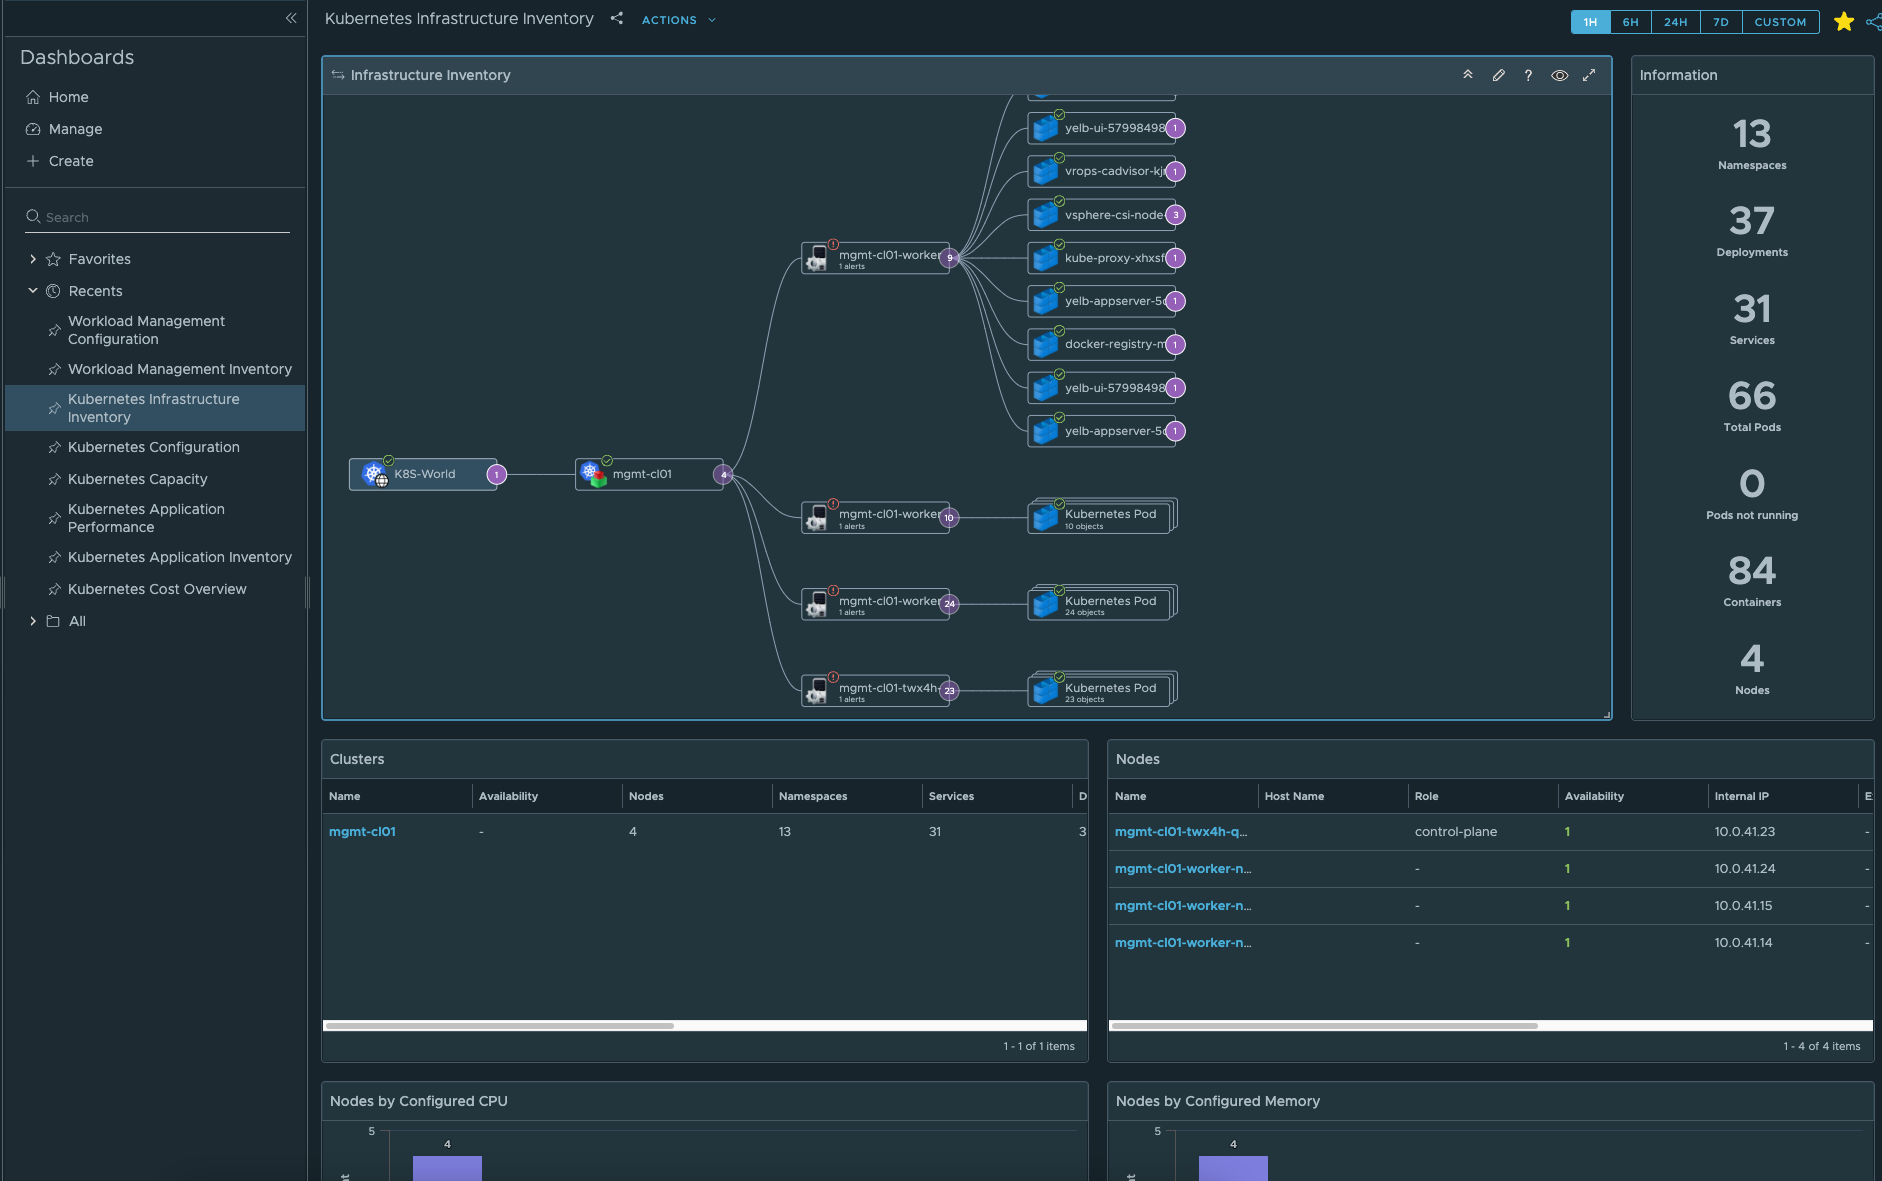
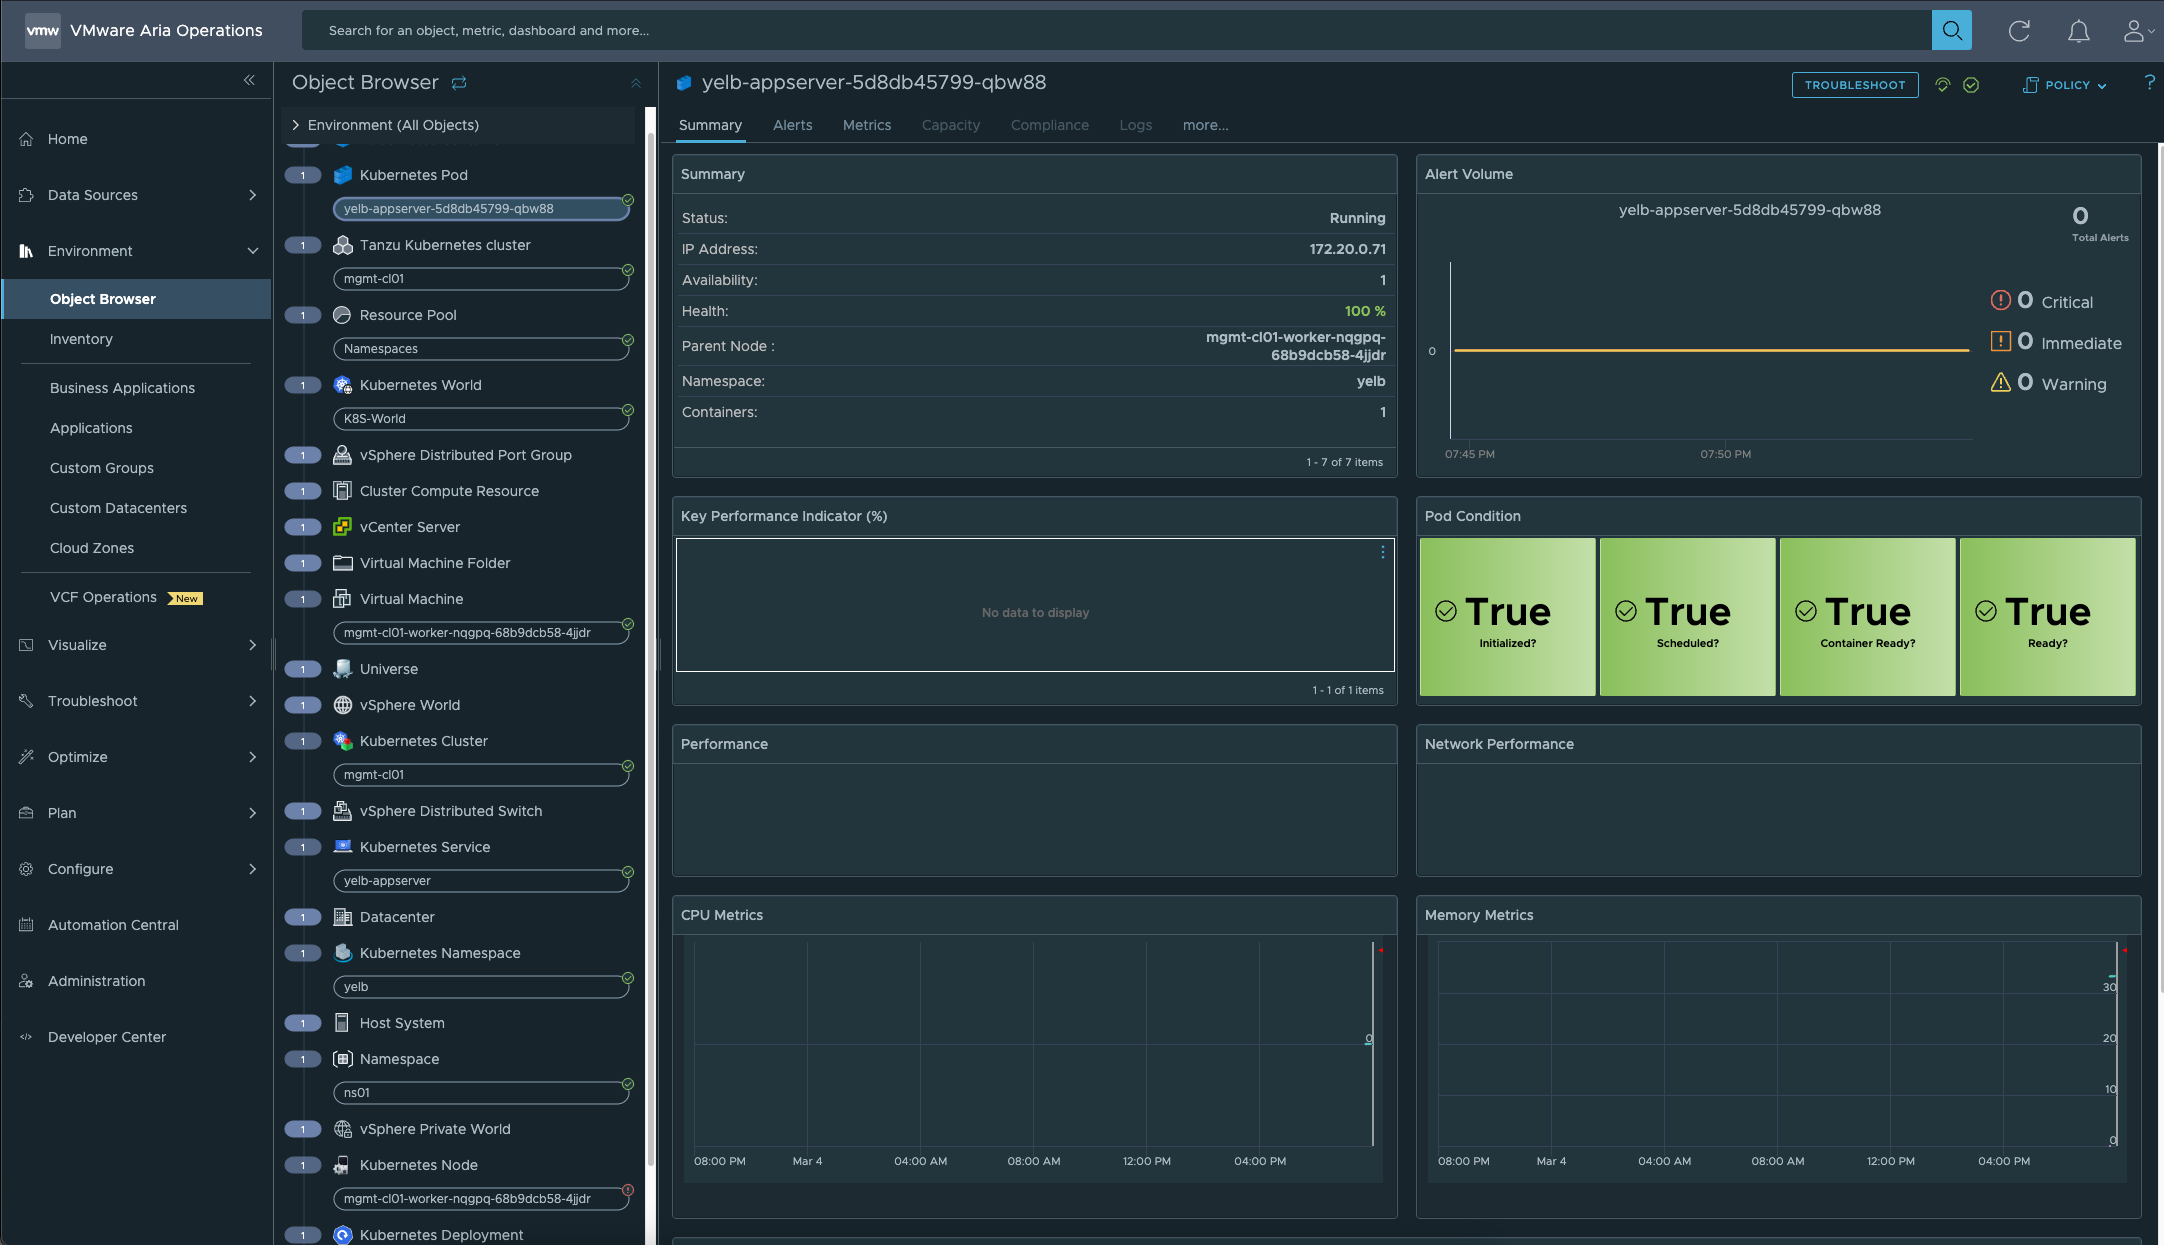
3. In dashboard Kubernetes Infrastructure Inventory you can see a different data – pods. Go deeper and see more details by clicking on every node and pod. Than, you will be redirected to the Object Browser section.
4. Remember, gathering all monitoring data can take some time.


7 Comments
Do you know if it’s possible to monitor the supervisor cluster ?
Hey!
Hmm I see two options:
1. Check the VMware Aria Operations Management Pack for Kubernetes 2.2 https://marketplace.cloud.vmware.com/services/details/vmware-aria-operations-management-pack-for-kubernetes-2-2-2?slug=true (instead of 2.1 like in this post) because, in 2.2 they added support for Supervisor monitoring and TKC: https://docs.vmware.com/en/VMware-Aria-Operations-for-Integrations/services/rn/vmware-aria-operations-for-integrations-release-notes/index.html
2. You can use a Telegram to monitor Supervisor nodes: https://docs.vmware.com/en/VMware-vSphere/8.0/vsphere-with-tanzu-installation-configuration/GUID-9EFBA053-2D4E-44F5-B8CD-9B90C351C250.html
Regards!
Mateusz
Question: how can i find my “Certificate Auth as a Credential Kind. Certificate Authority Data, Client Certificate Data, Client Key data””
Hey!
Certificate Auth as a Credential Kind. Certificate Authority Data, Client Certificate Data, Client Key data copy from your local kubeconfig file.
Default location of the Kubeconfig file in Linux and Mac is:
~/.kube/config
At the beginning of the file you can find Certificate Authority Data:
apiVersion: v1
clusters:
– cluster:
certificate-authority-data:
[data]
server: https://[IP_address]:6443
name: [your K8S cluster name]
Than, further in the file you can find Client Certificate Data, Client Key:
users:
– name: [your K8S cluster name]
user:
client-certificate-data:
[data]
client-key-data:
[data]
what if from my kubeconfig file instead of client-certificate-data and client-key-data it only shows both token
I only see my certificate authority data from my kubeconfig file. It doesn’t include cl;ent-certificate-data and client-key data. Do you have any workaround how can I generate it to my kubeconfig file?
I’d like to point out that the author is suggesting using the local kubeconfig credentials. Often, this is an account with a `cluster-admin` role attached. You’re giving Aria Operations full root access on your cluster. Using these credentials in Aria Operations is highly undesirable and contradicts the principle of least privilege.
If client certificate authentication needs to be used, create a separate role or group that has only the required permissions and generate a kubeconfig for that.
I haven’t verified this yet, but I’m also unsure why Aria Operations would even need the client certificate authentication in the first place. If cAdvisor runs as a DaemonSet on each node, metrics can be scraped freely without any authentication. I’d suggest adding a reverse proxy to add a layer of authentication.